Instant measurement vs long term trends
- Posted by Ken Fretwell
- On February 14, 2020
- 0 Comments
Whats more useful, data from your current training session or long term trends in performance data?
Our Equine analytics platform collects an incredibly large amount of data. Infact the average track ride produces around 2 million data points.
Most trainers progress through a measurement pattern as follows:
- Simple stop watch sectional recording, combined with a great memory for numbers over time. This also include monitoring of post ride heart rates.
- Most people then progress to writing these figures down in a notebook.
- The next step they take is to digitize it and most likely record in in a spreadsheet of some sort, possibly outputting a graph over time.
At this stage there’s some good data being captured, but unless you can do something with this, i.e. gain and insight you can make a change based on (Actionable Insights) then its most likely just filling in your day unnecessarily.
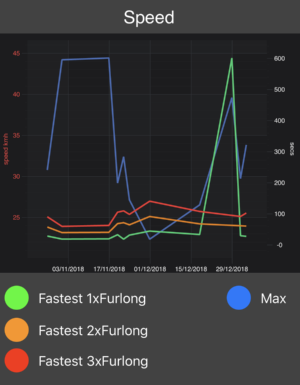
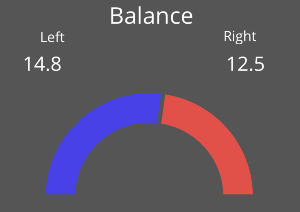
We’ve automated all of this into dashboards that show you these long term trends. Trends based on speed (sectionals) heart rate (training zones and recovery) and movement (changes that indicate and injury or the onset of an injury)

Suddenly this level of data is useful again, it allows you to quickly see if anything has changed, or (hopefully) if your training targets are being met. Now you have Actionable Insights, key pointers that either backup what you are seeing and what your Jockeys are saying during track work, or that provide you a hint to look at something that may be an issue.
Being able to shift your focus away from day to day track work to look at the bigger picture is incredibly powerful, you may have noticed a trend in the wrong direction over the past weeks worth of track work, but being able to see that the trend over the horses build up period is going in the right direction can encourage you to stay with what you are doing (assuming what you are seeing as a trainer is also backed up by this “gut feel”).
The next step in this kind of data analysis is being able to take the learnings you have with our dashboards, and apply them to new horses that come into your stables. Having the data that shows what your training program can do with a given kind of horse becomes a very powerful tool, and reflects on your skill set as a horse trainer, and what you can deliver for its owners.


